Chart.js Canvas PCF

Chart.js Canvas PCF
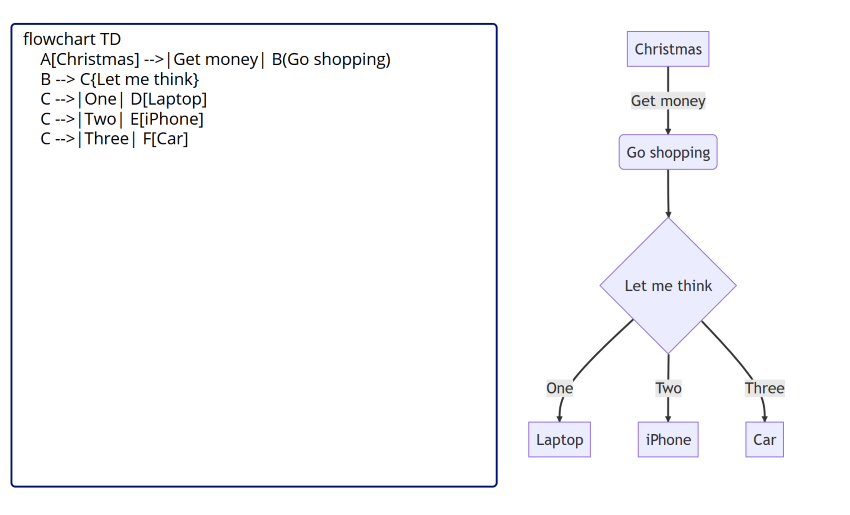
A control to utilize Chart.js to display interactive charts for Canvas Apps.
Author: Stephen Belli
Position Org Chart
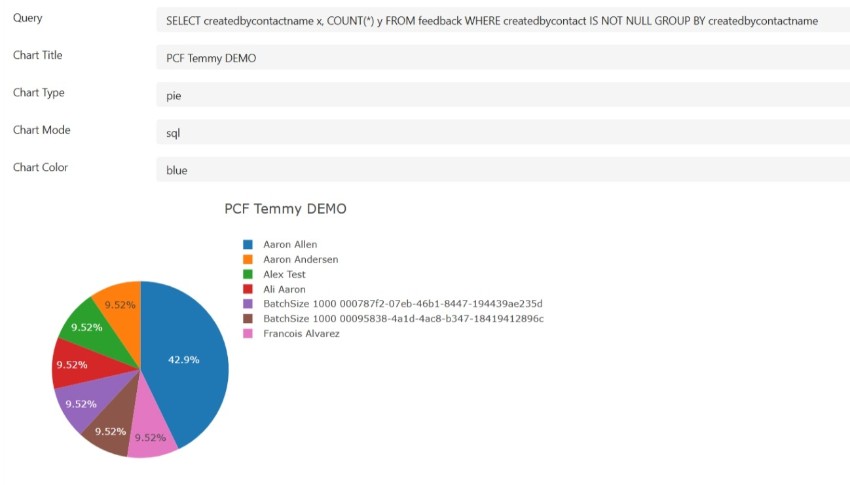
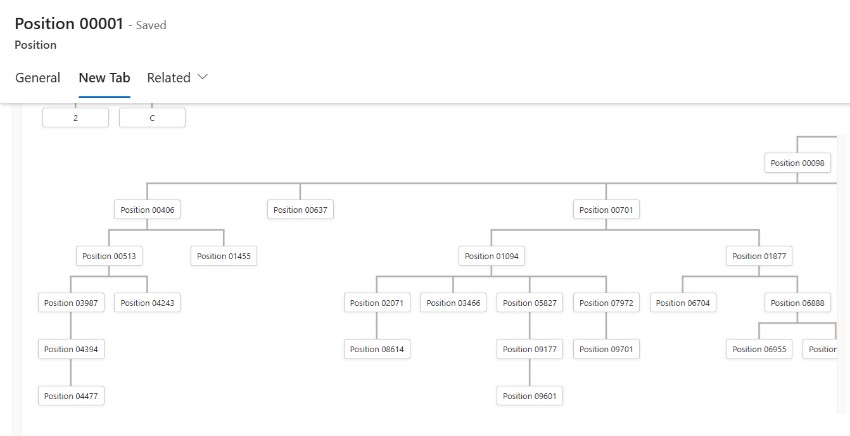
A control that renders an interactive org chart for the Position table in Microsoft Dataverse.
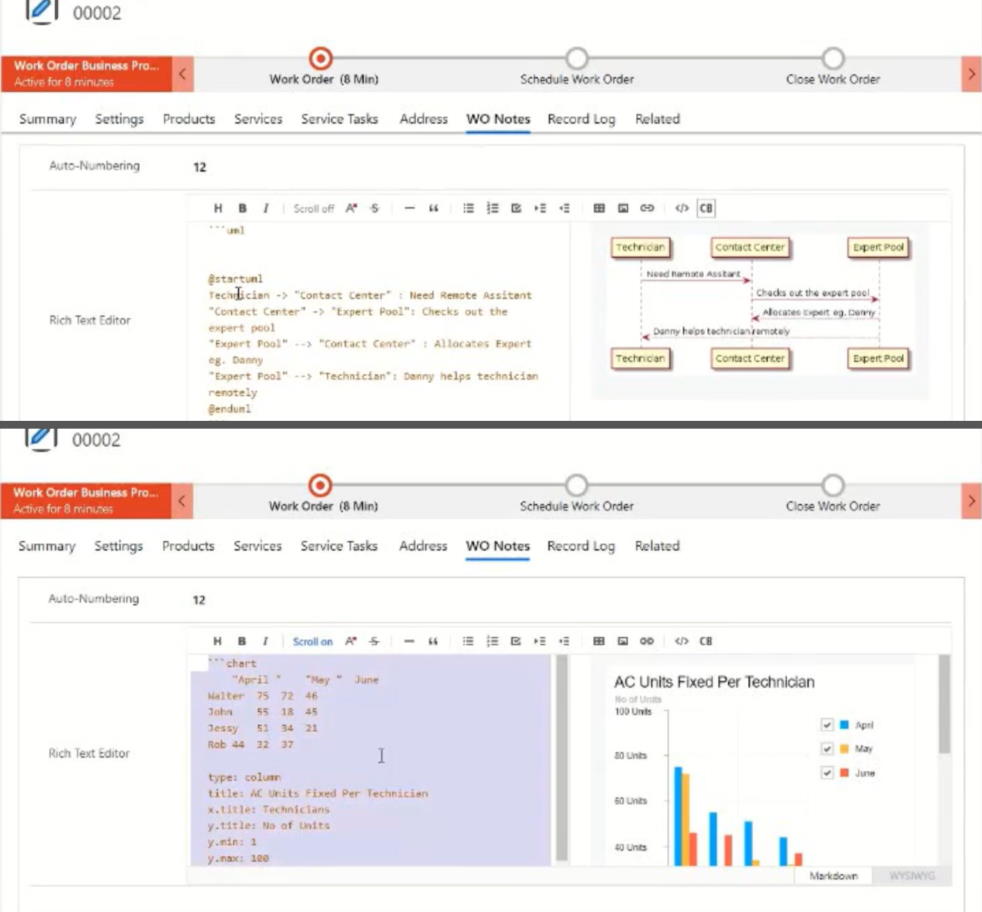
Rich Text Editor with Chart & UML Designer
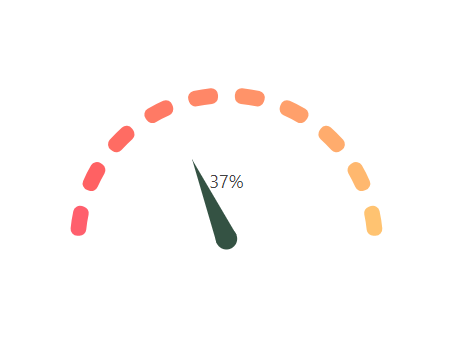
A control to embed Charts and to create UML diagrams (plant UML)
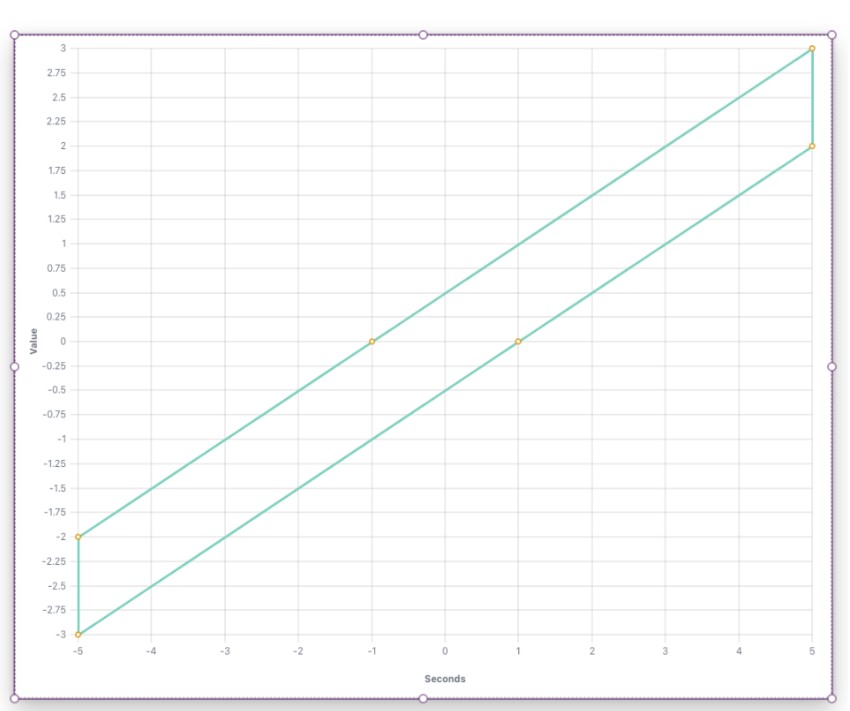
CurveChart PCF
A control for Canvas apps and Custom Pages that renders interactive XY curve/line charts from JSON.